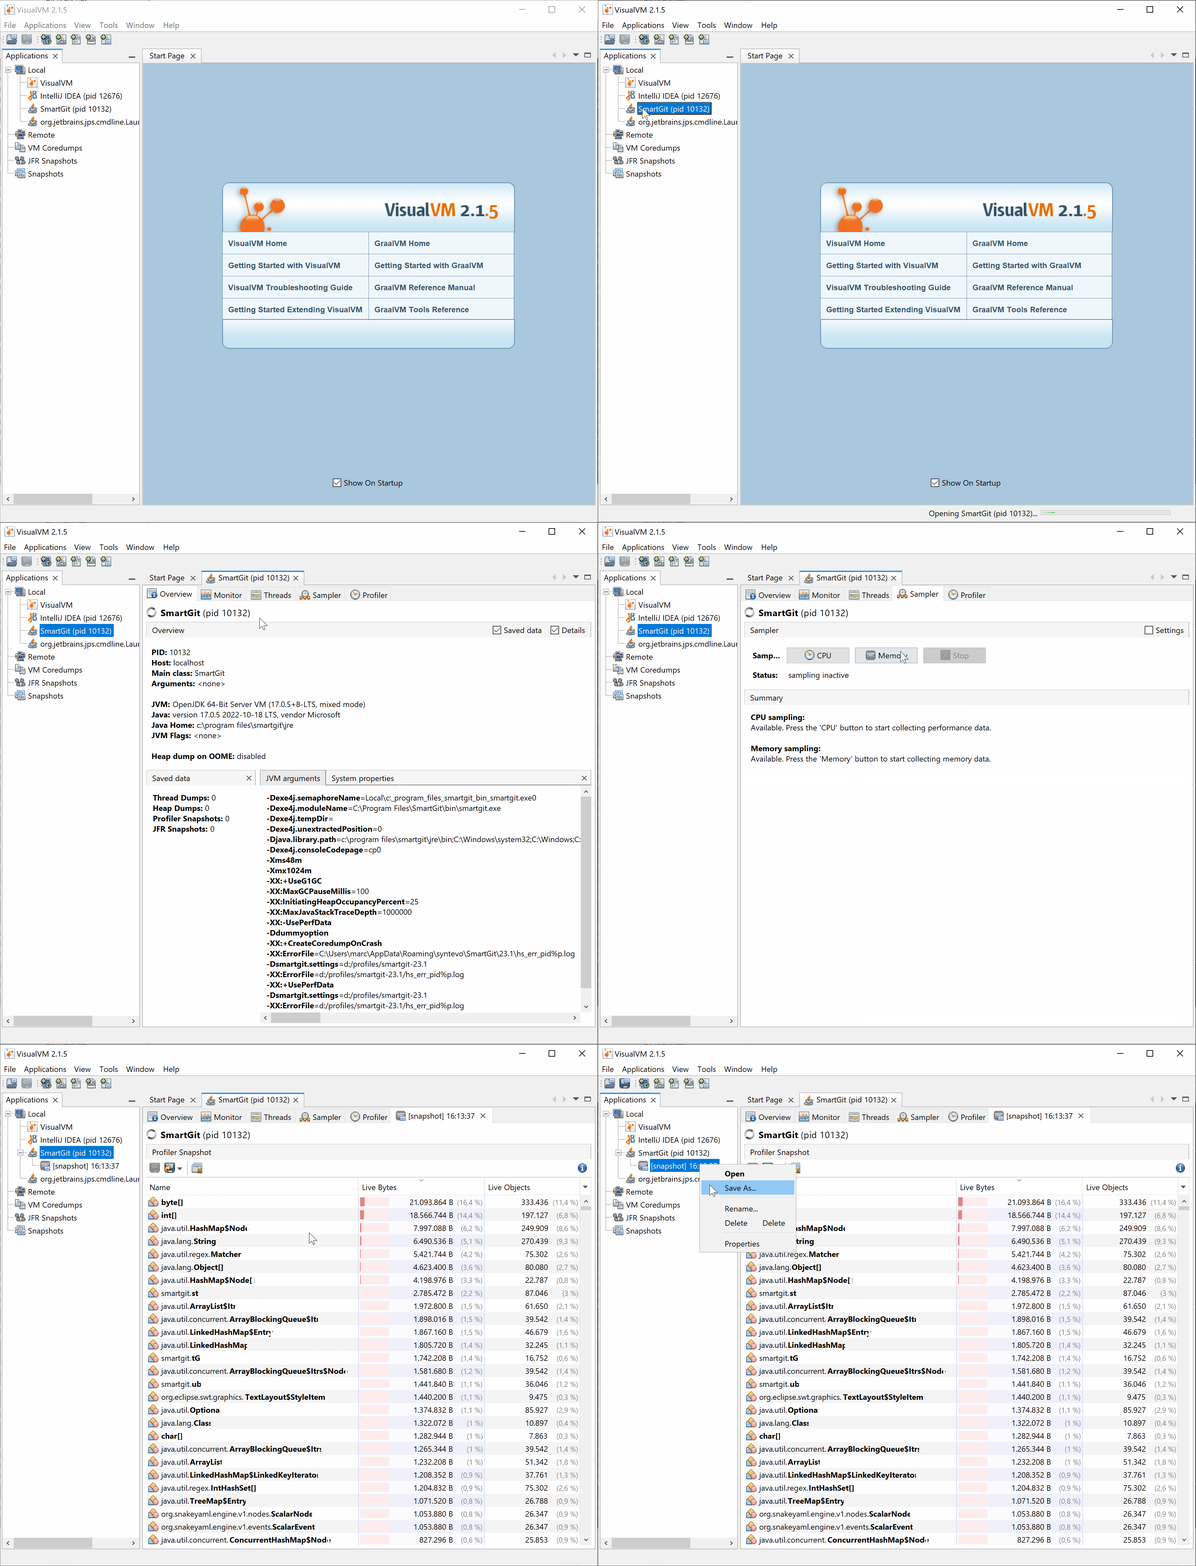
Inspecting SmartGit’s process using VisualVM
VisualVM is a free Java Profiler. This document is written for running VisualVM on Windows. For Linux and macOS, paths have to be adjusted accordingly.
-
Download JDK 17 (LTS), e.g. from azul.com (unless you already have a JDK 17 installed) and uncompress to e.g.
C:\jdk.Warning
Be sure to select the correct platform, architecture (x86/x64 for Windows) and bundle: .zip for Windows, .tar.gz for Linux and .dmg for macOS.
-
Download VisualVM from visualvm.github.io and uncompress to e.g.
C:\visualvm - Configure SmartGit to collect performance data (required since version 23.1):
- open bin/smartgit.vmoptions and append:
-XX:+UsePerfData
Warning
Without this step, SmartGit will not occur in the list of local applications in VisualVM.
- open bin/smartgit.vmoptions and append:
- Run VisualVM:
- open a terminal
cdtoC:\visualvm\bin- start
visualvm --jdkhome C:\jdk
- Once VisualVM has started up, locate the SmartGit-related VMs: there will be one main VM, if SmartGit is running (on Windows showing up as
SmartGit, on Mac/Linux showing up asQBootLoader). If a SmartGit upgrade is in progress, there will be an additional VM (on Windows showing up asSmartGitUpdater). If SSH connections are currently in progress, there may be more VMs.
Note
If you can’t connect to SmartGitUpdater VM, try again running VisualVM as administrator, because SmartGitUpdater is usually invoked with administrative privileges, too.
Taking thread dumps
Thread dumps are useful to investigate hangs or slow performance.
- Select the VM you want to inspect.
- Select tab Threads and invoke Thread Dump.
- When investigating a problem, it’s usually a good idea to create a couple of thread dumps.
Taking a heap snapshot
Heap snapshots are useful to investigate memory-related problems and do not contain any sensitive information.
-
Select the VM you want to inspect.
-
Select tab Sampler, click Memory and then Snapshot.
-
Right-click the snapshot, save it using Save As, then send it to us.

Taking a heap dump
Heap dumps are useful to investigate memory-related problems.
-
Select the VM you want to inspect.
-
Select tab Monitor and invoke Heap Dump.
-
To investigate the current state yourself, the Classes section will give you a good overview of the memory usage: sorting by Instances and Size can be helpful to detect (unusually) large occurrences of specific classes. By double-clicking a certain class, you will switch to the Instances view which gives you detailed information for every object of this class.
-
To take a full heap dump for debug purposes, select the Monitor section and hit the Heap Dump button there.
Note
For heap dumps, it’s expected to see a lot of
char[],byte[]andStringobjects, as version control is more or less all about bytes and texts (paths, file contents, commit messages).
Heap dumps are usually huge, so first thing to do is to store them locally using Save As from the context menu in the Applications view. This way they can be accessed later on and if necessary can be transferred to us.
